Observability
See what's happening in your Motia app with logging, tracing, and debugging
Your app is running. But what's actually happening inside?
- Is that API getting hit?
- Did the message get enqueued?
- Why did that Step fail?
- Which user triggered this flow?
Motia gives you everything you need to answer these questions.
Logging
Every Step can use the logger imported from Motia. Use it to see what's happening.
Log Levels
| Level | When to use it |
|---|---|
info | Normal stuff - "User created", "Order processed" |
warn | Something's weird but not broken - "High API usage", "Slow response" |
error | Things broke - Failed API calls, exceptions, crashes |
debug | Deep debugging - Raw data, internal state, timing info |
How to Log
Always add context data to your logs. { orderId: '123' } is way more useful than just a message.
Where to See Logs
Start your app:
Logs appear in two places:
1. Your Terminal
See logs right where you ran npm run dev:
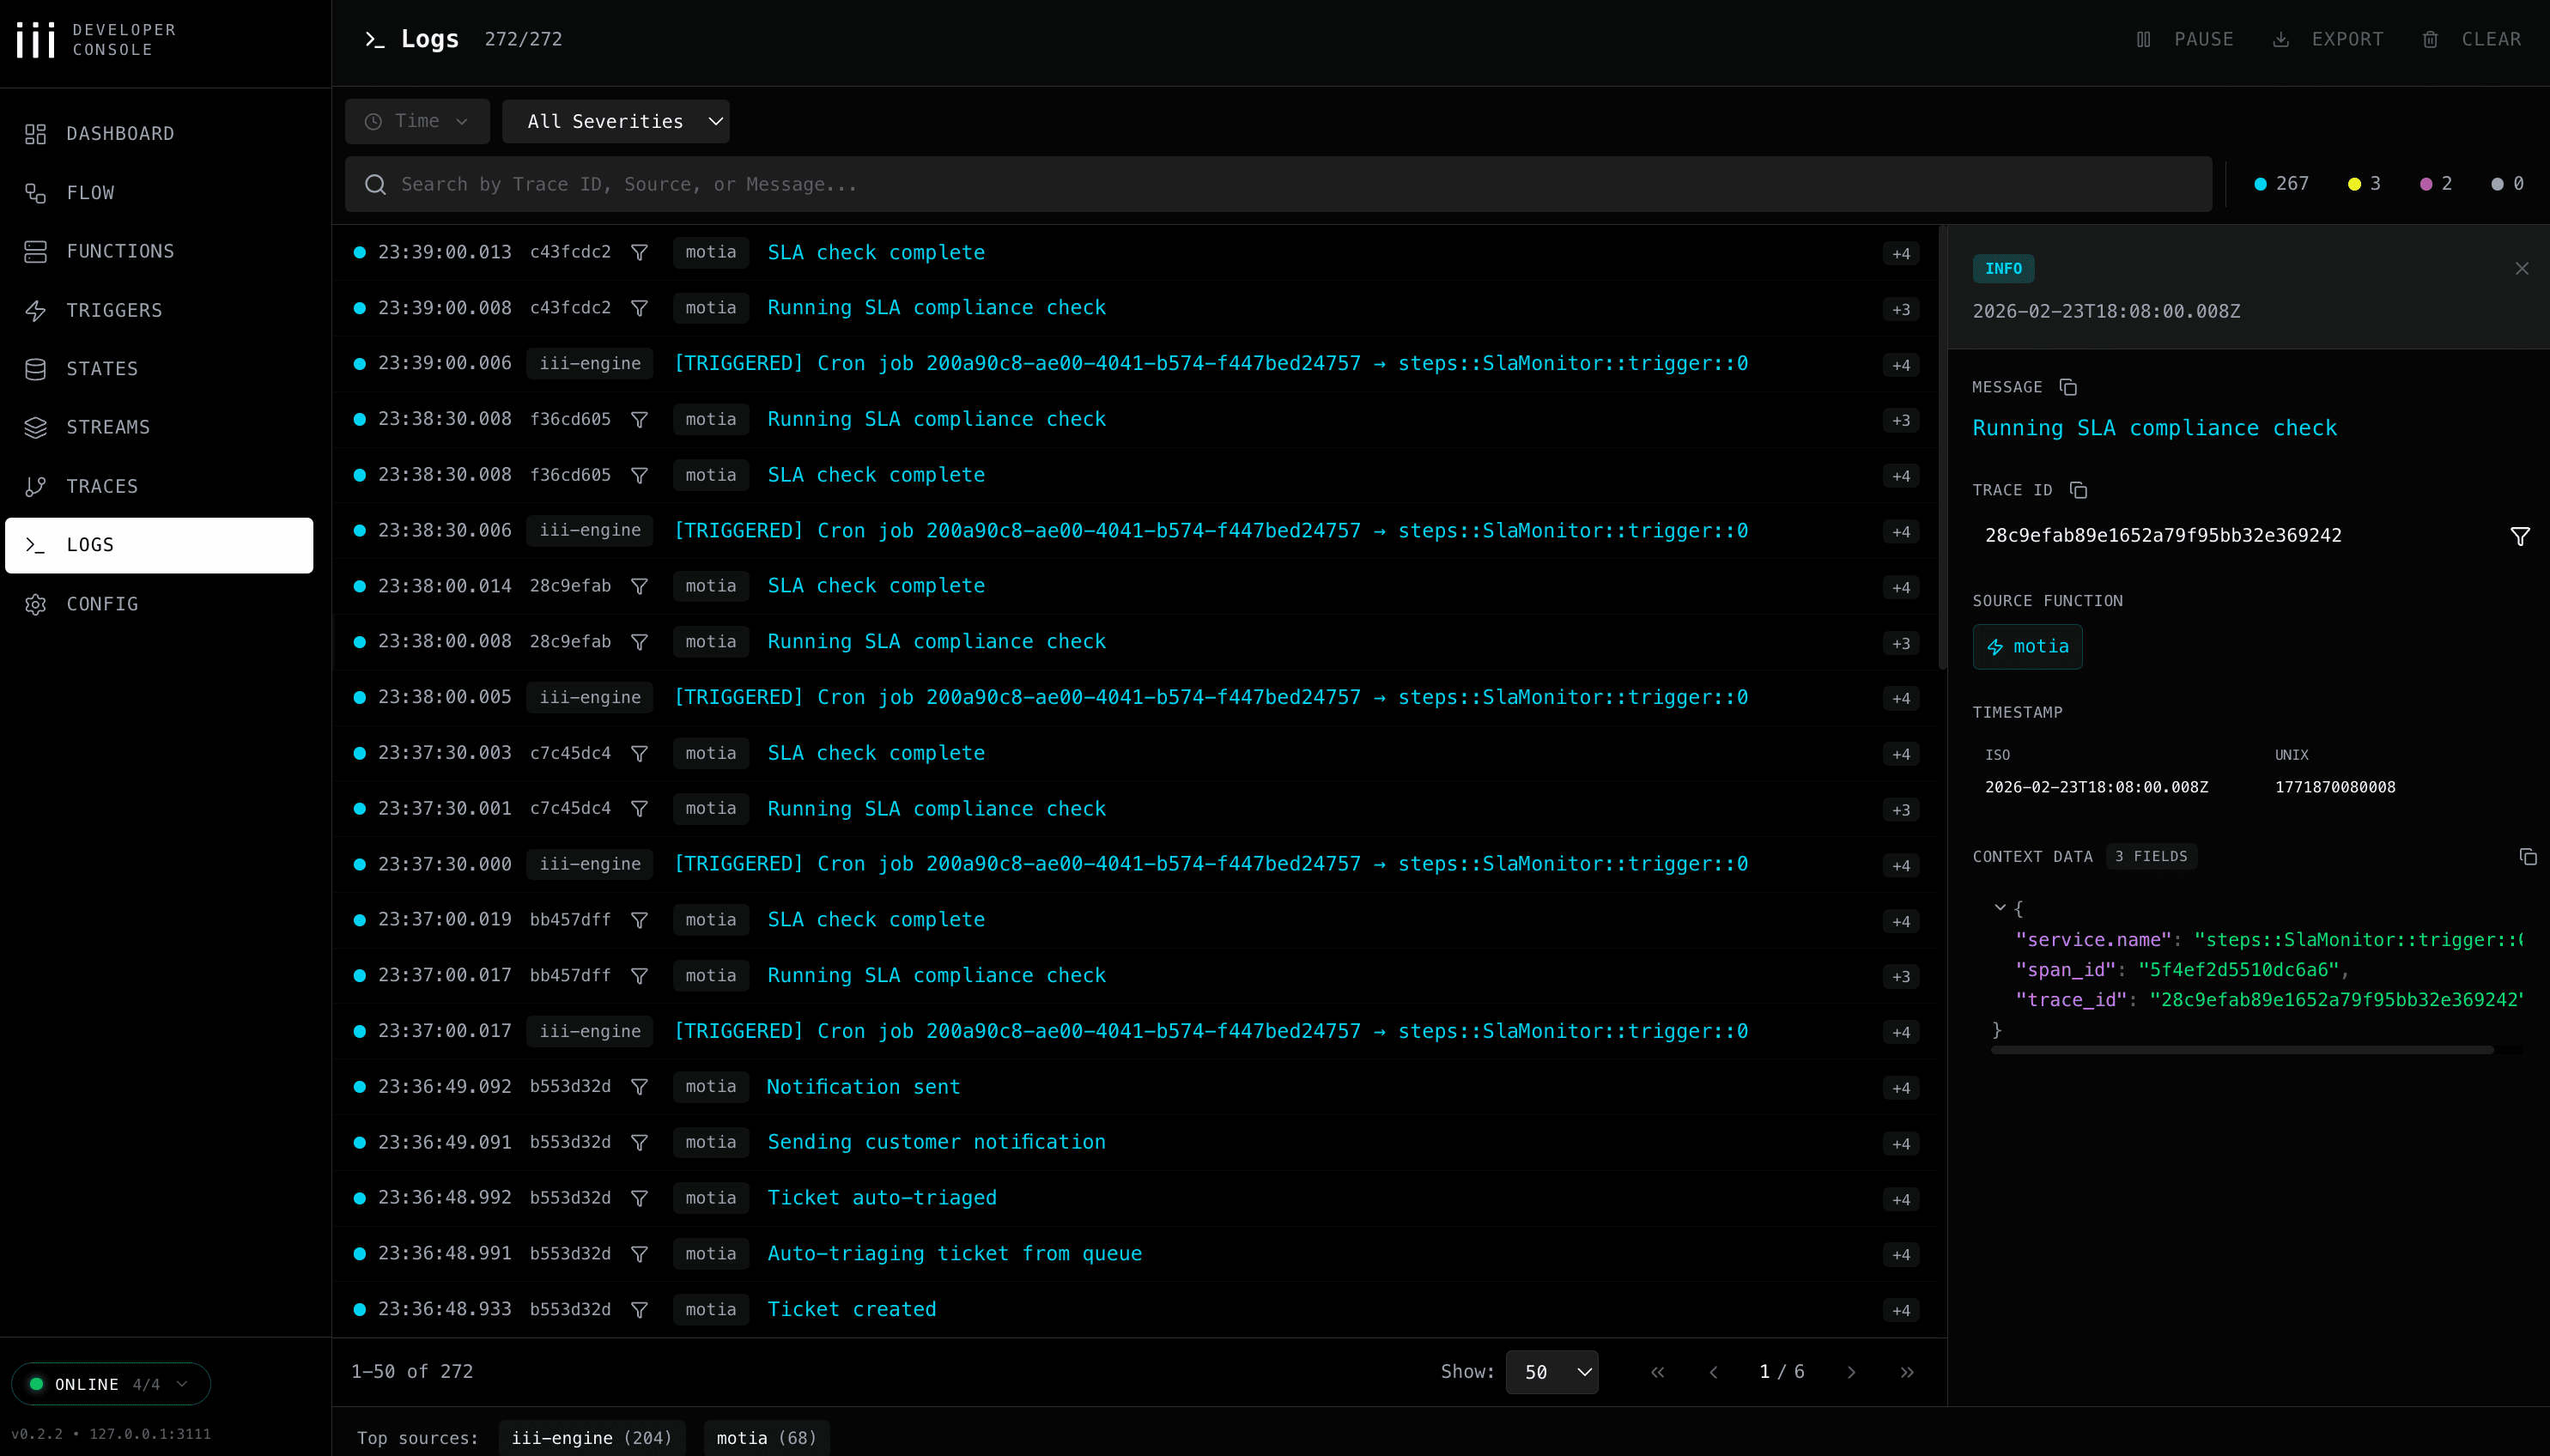
2. The iii Development Console
Open the iii development console and click on your flow. Logs show up in real-time with:
- Timestamps
- Which Step logged it
- The trace ID (to follow a request through the entire flow)
- Full context data
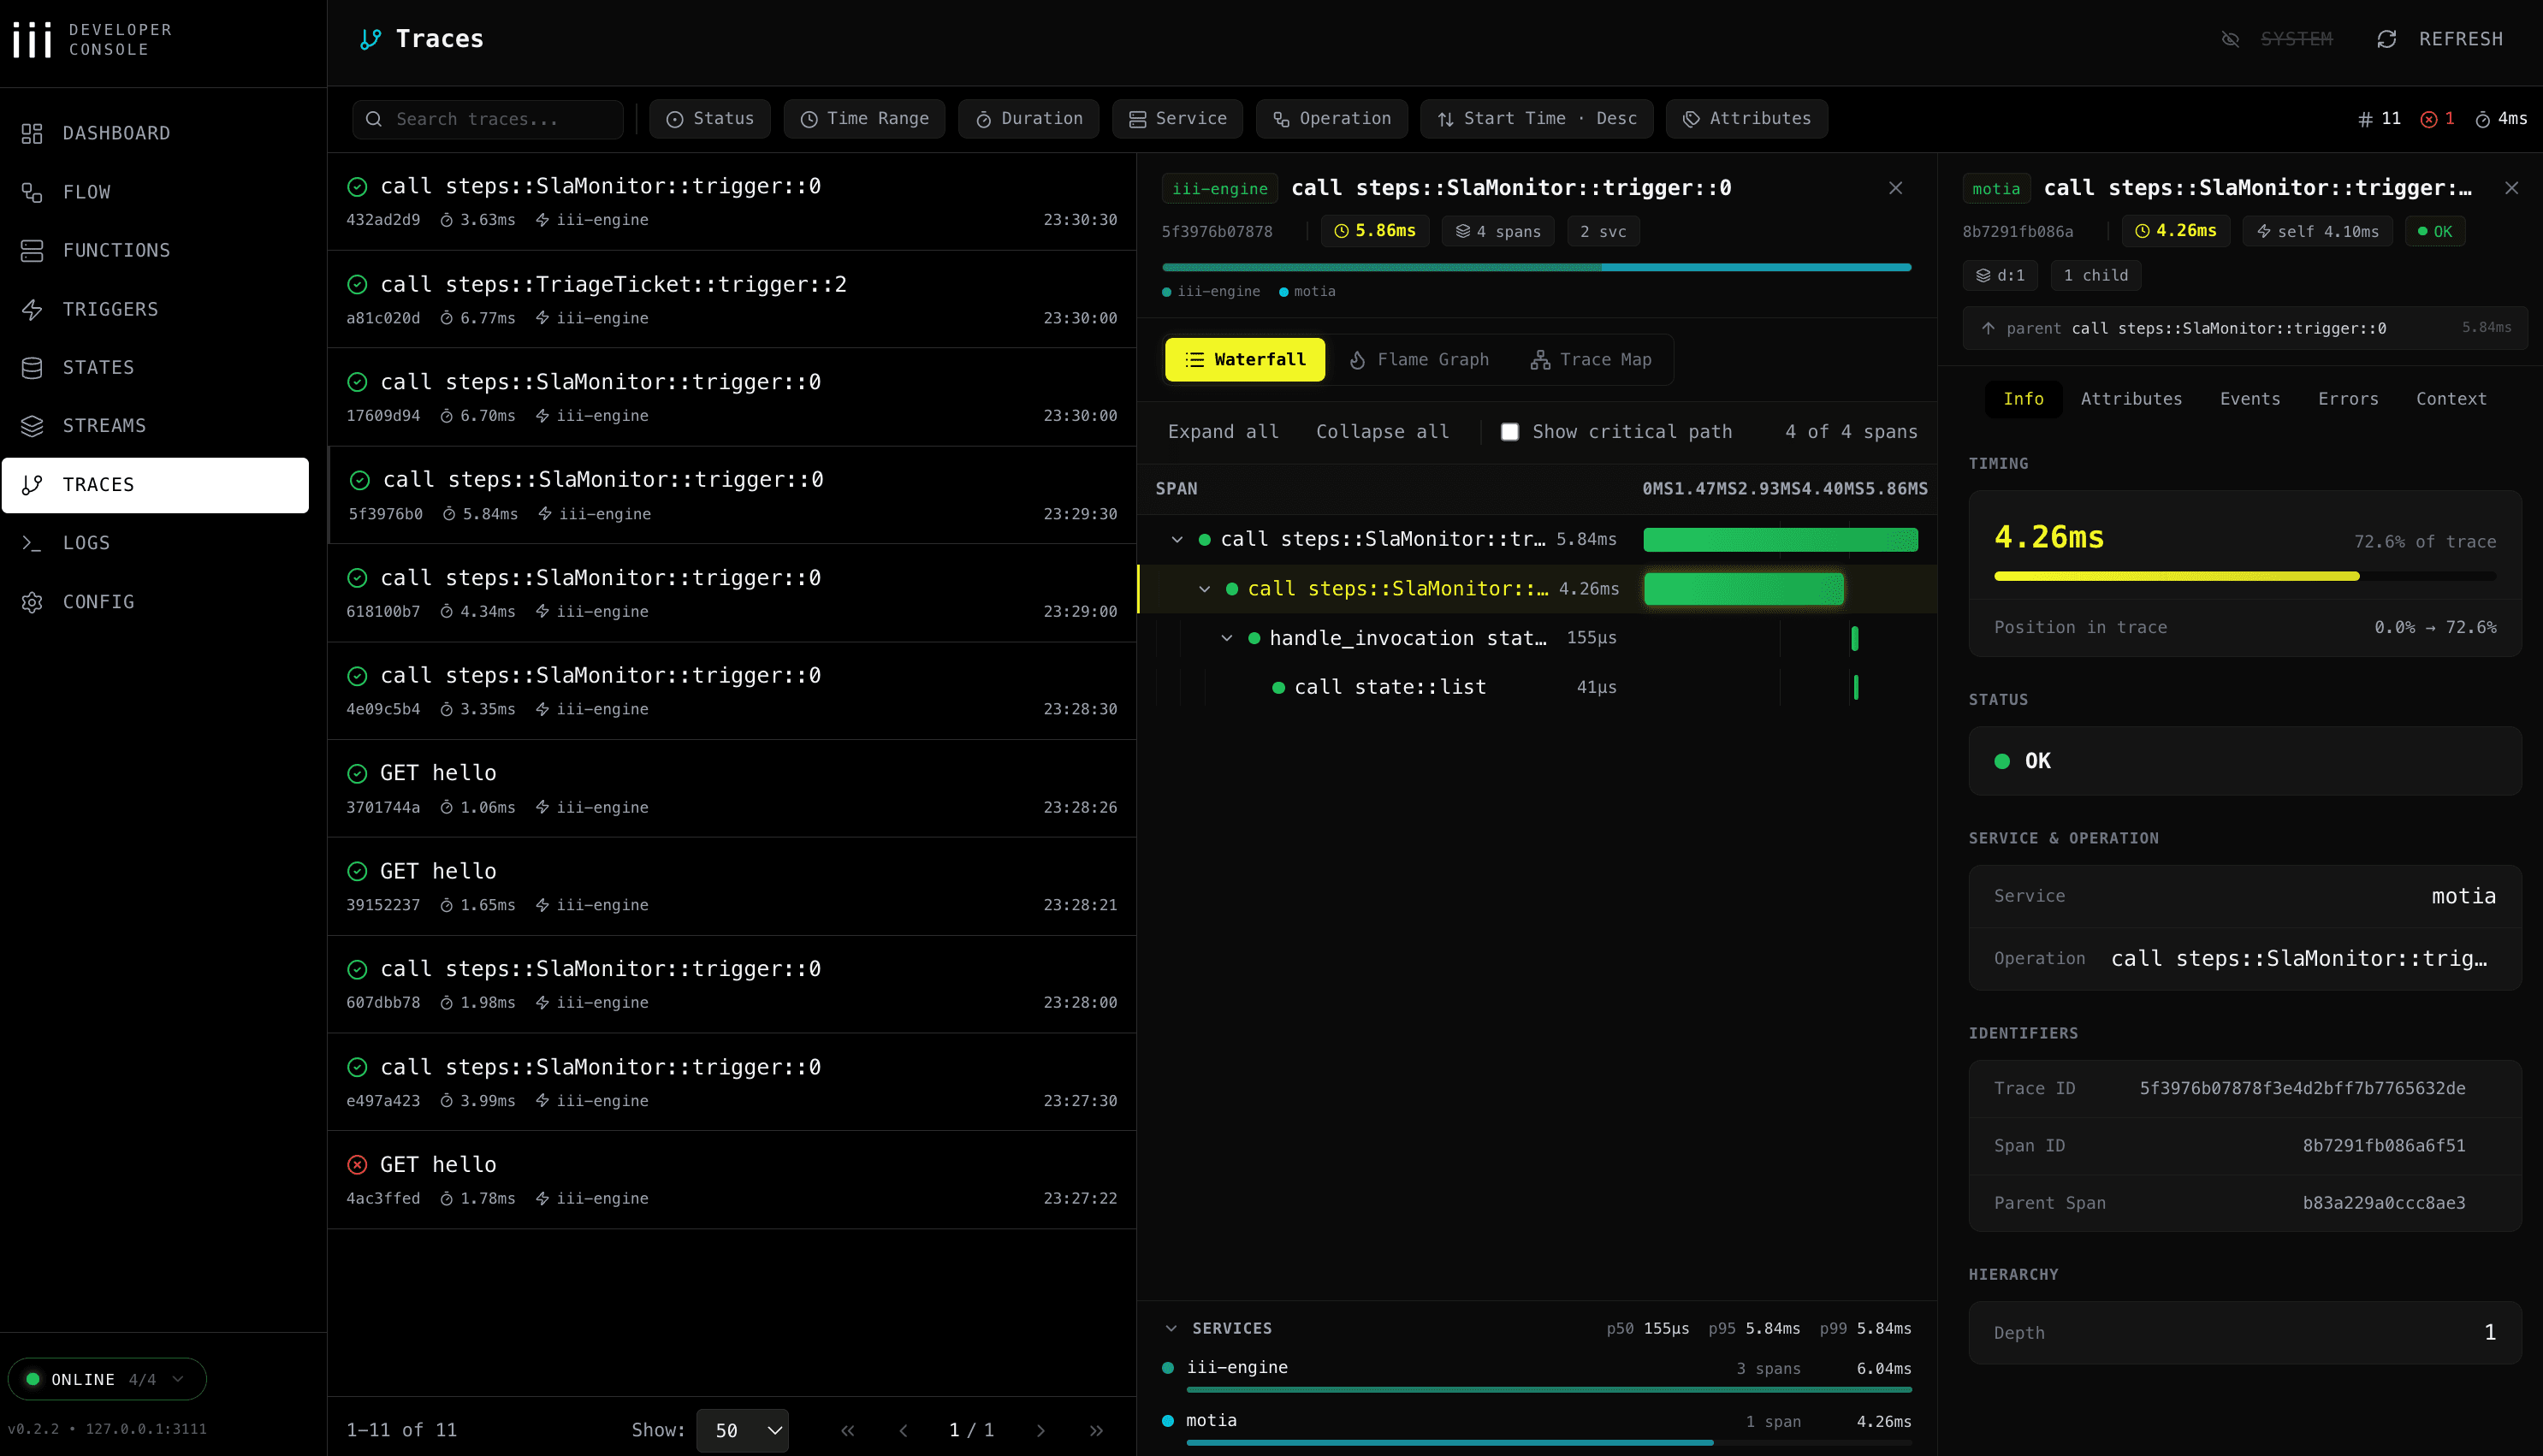
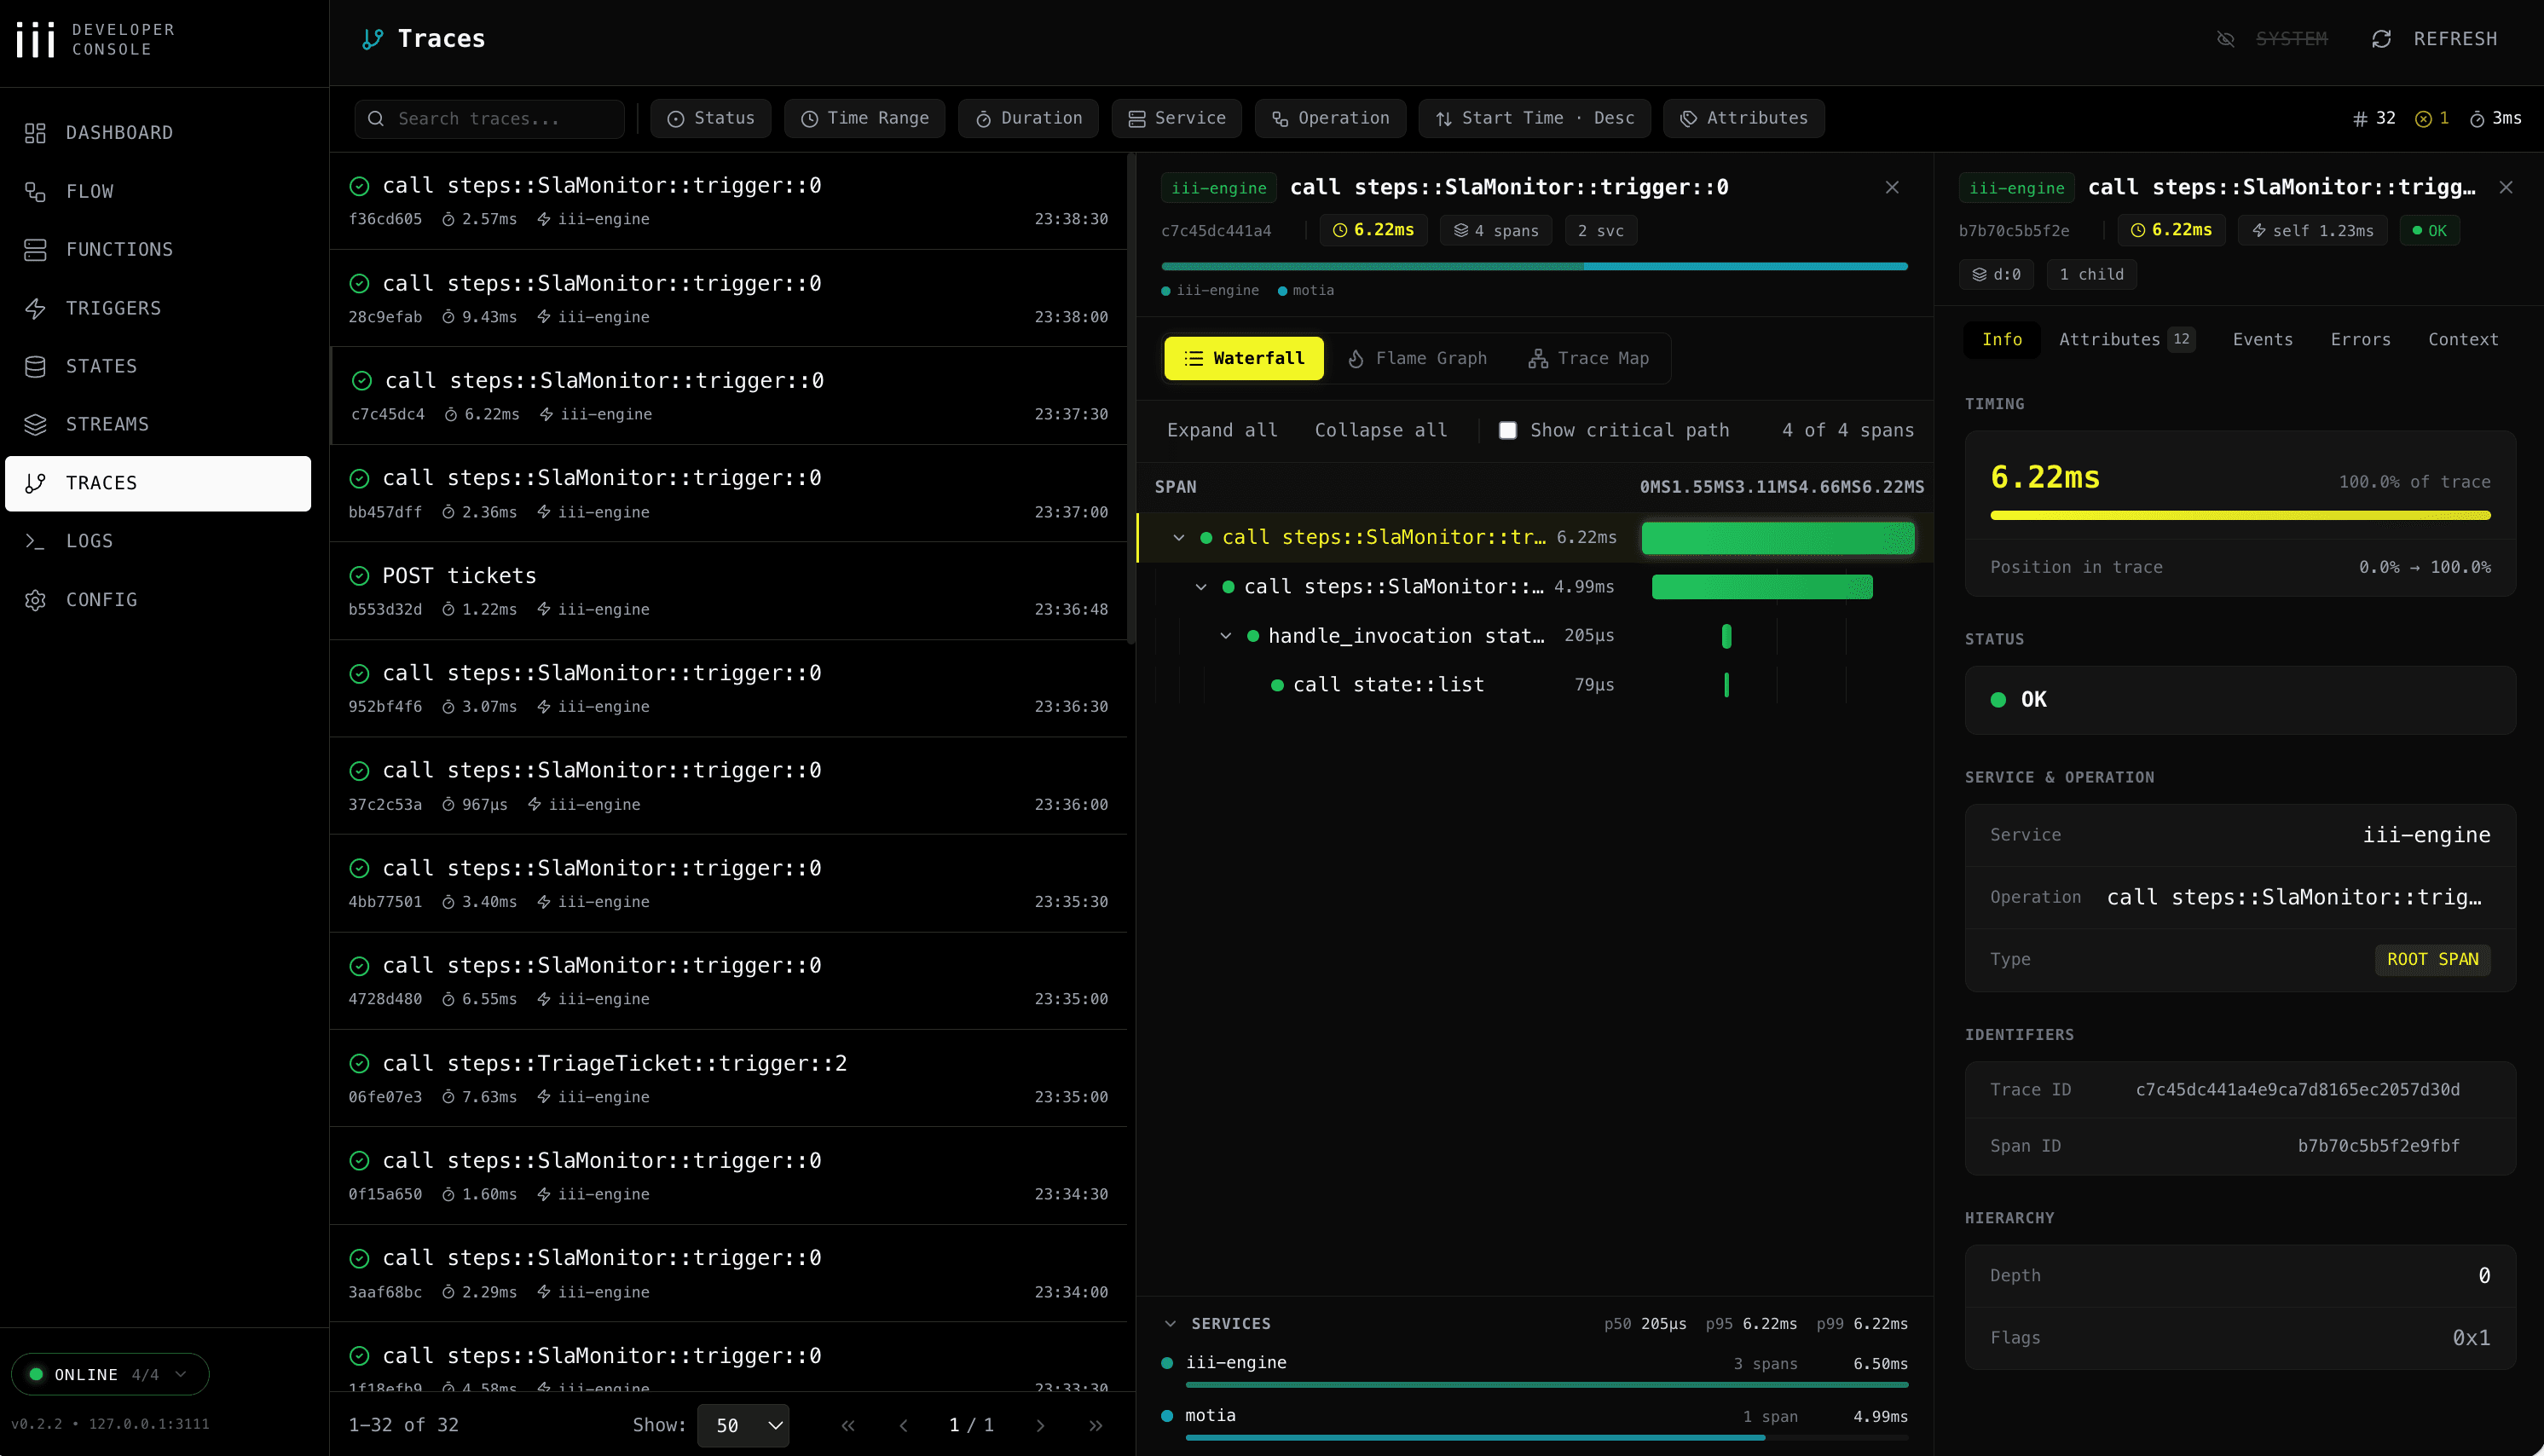
Tracing
Every request gets a unique traceId. This lets you follow a single request through your entire flow.
In the iii development console:
- Click any log entry
- See all logs with the same
traceId - Follow the request from start to finish
Debug Mode
Want more detailed logs?
This enables debug level logs. You'll see everything - raw inputs, internal state, timing info.
In production: Don't use debug mode (it's slow and logs everything).
Tips for Better Logs
Use Objects, Not Strings
Good:
Bad:
Why? Objects are searchable, filterable, and easier to parse.
Track Performance
Log Errors Properly
Debugging Workflows
Problem: Something's not working, but where?
Steps to debug:
- Check terminal logs - See which Steps ran
- Open the iii development console at http://localhost:3113
- Click your flow - See the visual diagram
- Expand logs panel - See all logs in chronological order
- Click a log - Filter by that
traceIdto follow the request - Check each Step - See where it failed
Common Issues
API not responding?
- Check if the Step ran: Look for logs with your Step's name
- Check the response: Look for
status: 200in logs
Message not being processed?
- Check if
enqueue()was called: Search logs for "enqueue" - Check the topic name: Make sure it matches the queue trigger topic
Step not running?
- Check if it's discovered: Look for
[CREATED] Stepin startup logs - Check the file name: Must contain
.step.or_step
Remember
- Log everything important - But not everything (no sensitive data!)
- Use
traceId- Follow requests through your entire flow - Check the iii development console - Visual debugging is easier
- Use objects - Don't log strings, log objects
- Debug mode - Only for development, never in production